Plataforma de Educação Humanizada

Torne-se Membro

Snack and Graph with Froot Loops

Disciplina:
Ano escolar: 1st
Tipo de Recurso:
Tags:

Froot Loops cereal (one handful per student)
Small paper plates or bowls (for sorting)
Graph paper or large paper for creating graphs
Markers or colored pens
Glue sticks (optional)
Rulers (optional)
Introduction (5 minutes):

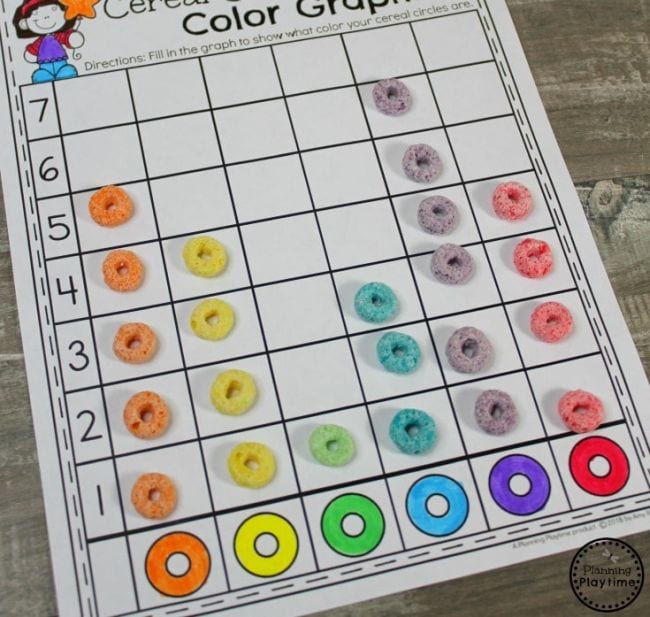
Explain the purpose of the activity: creating a graph to show how many of each color of Froot Loops is present.
Briefly review what a bar graph is and how it can be used to display data.
Distributing Materials (5 minutes):

Give each student a handful of Froot Loops.
Provide paper plates or bowls for sorting the Froot Loops by color.
Sorting and Counting (10 minutes):

Instruct students to sort their Froot Loops by color and count how many of each color they have.
Have students record their counts on a piece of paper.
Creating the Graph (15 minutes):

Provide students with graph paper or large paper.
Show students how to set up their bar graph with the x-axis labeled for colors and the y-axis for the number of Froot Loops.
Have students draw bars for each color based on their counts. They can use markers to color the bars matching the Froot Loop colors.
Discussion and Snack Time (10 minutes):

Once the graphs are complete, allow students to share their graphs with the class, explaining which color had the most or least Froot Loops.
Let students enjoy their Froot Loops as a snack.
Review and Reflection (5 minutes):

Recap the key parts of a bar graph and how it represents data.
Ask students what they learned from the activity and how the graph helped them understand the data.