Plataforma de Educação Humanizada

Torne-se Membro

Record Eye Color and Create a Pie Graph

Disciplina:
Ano escolar: 1st
Tipo de Recurso:
Tags:

Small pieces of construction paper (in colors representing different eye colors)
Chart paper
Glue or tape
Markers or colored pens
Scissors
Rulers (optional)
Pencils
Introduction (5 minutes):

Explain the activity and its objectives. Discuss how students will record eye colors, create a pie graph, and visually represent the data.
Show examples of pie graphs and explain how they represent parts of a whole.
Recording Eye Colors (10 minutes):

Have students record the eye color of each classmate. This can be done by asking each student to state their eye color and noting it down.
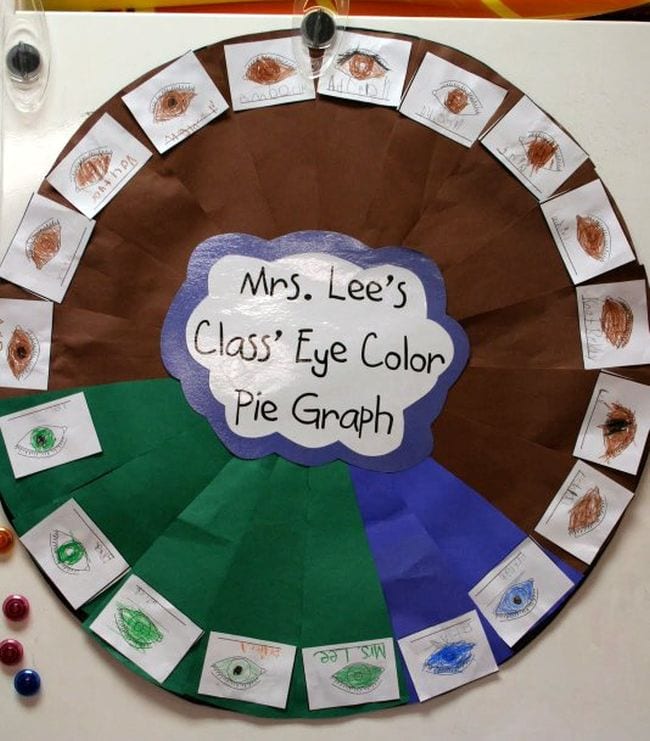
Provide each student with a small piece of construction paper to draw their eye color.
Creating the Pie Graph (20 minutes):

Provide students with chart paper to draw their pie graph.
Instruct students to divide the chart paper into sections according to the number of different eye colors observed.
Have students paste their construction paper pieces onto the chart paper, creating sections that correspond to the number of classmates with each eye color.
Assembling the Pie Graph (15 minutes):

Students will use glue or tape to secure the small pieces of construction paper onto the pie graph.
Guide students in labeling each section of the pie graph with the corresponding eye color and the number of students with that color.
Presentation and Discussion (10 minutes):

Allow students to present their pie graphs to the class, explaining the distribution of eye colors and how they created their graphs.
Discuss any observations or trends, such as which eye color is most or least common.
Review and Reflection (5 minutes):

Recap the key components of creating and interpreting a pie graph.
Ask students what they learned from the activity and how it helped them understand data representation.