Plataforma de Educação Humanizada

Torne-se Membro

Graphing Coin Flip Results

Disciplina:
Ano escolar: 2nd
Tipo de Recurso:
Tags:

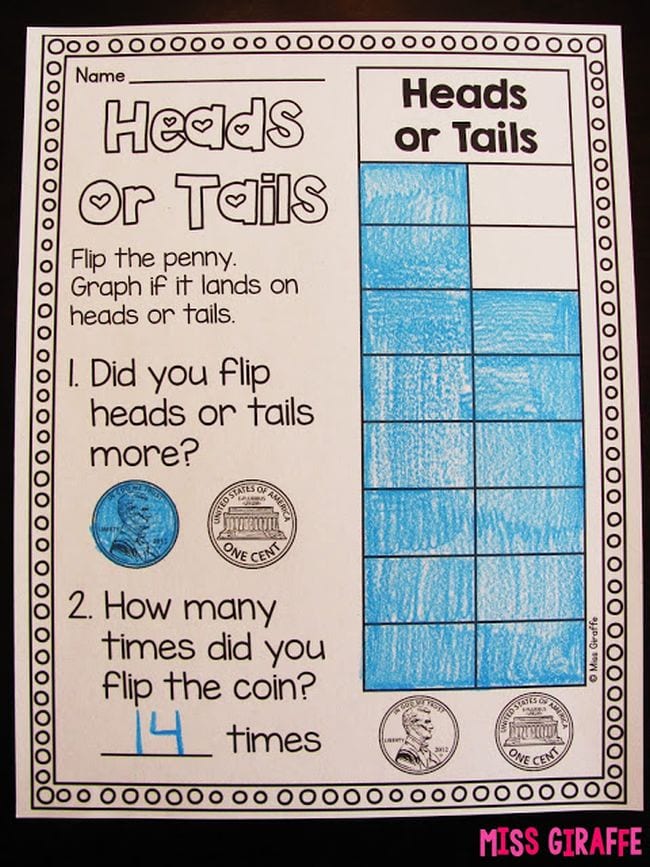
Worksheets with a heads and tails image on the x-axis (or create your own)
A coin for each student or pair of students
Pencils or markers
Graph paper or large poster paper
Introduction (5 minutes):

Explain the activity and its objectives. Discuss how to record the results of the coin flips and how to represent these results on a graph.
Show students the worksheet with the heads and tails image on the x-axis.
Preparing for the Coin Flips (5 minutes):

Distribute a coin and a worksheet to each student or pair of students.
Explain how to flip the coin and record the results each time (e.g., heads or tails).
Coin Flipping Activity (15 minutes):

Have students flip their coins a set number of times (e.g., 20 flips).
Instruct students to record each result (heads or tails) on their worksheet.
Counting and Recording Results (10 minutes):

After all flips are completed, have students count how many times they got heads and how many times they got tails.
Students should record these counts on their worksheet.
Creating the Graph (15 minutes):

Provide students with graph paper or large poster paper.
Show students how to set up their graph with heads and tails on the x-axis and the number of occurrences on the y-axis.
Instruct students to draw bars for heads and tails based on their recorded counts.
Presentation and Discussion (10 minutes):

Allow students to present their graphs to the class, explaining their results and how the graph represents the number of heads and tails.
Discuss the results and any patterns observed in the data.
Review and Reflection (5 minutes):

Recap the key components of graphing and how it helps in organizing and interpreting data.
Ask students what they learned from the activity and how it helped them understand the concept of data representation.