Large poster paper or chart paper
Markers or colored pens
Rulers
Sticky notes or small index cards (optional)
Examples of different types of graphs (for reference)
Introduction (10 minutes):
Start by explaining the purpose of graphing and why it’s useful in presenting data.
Show examples of different types of graphs (bar graphs, line graphs, pie charts) and discuss their uses.
Creating Anchor Charts (30 minutes):
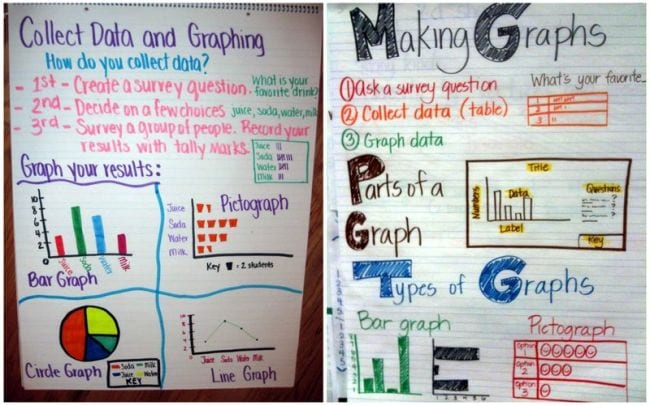
Divide students into small groups and assign each group a type of graph to create an anchor chart for (e.g., one group works on bar graphs, another on line graphs, etc.).
Provide each group with poster paper, markers, and examples for reference.
Instruct students to include the following components on their chart:
Title: Clearly state what the graph represents.
Axes Labels: Label the x-axis and y-axis or the sections of the graph.
Data Representation: Show how data is represented (e.g., bars for bar graphs, lines for line graphs, slices for pie charts).
Examples: Include a sample graph with labeled parts.
Presentation and Discussion (15 minutes):
Have each group present their anchor chart to the class.
Encourage students to explain the components and uses of their assigned type of graph.
Discuss the similarities and differences between the various types of graphs.
Practice and Application (15 minutes):
Provide students with a set of data and ask them to create a simple graph using the type they have studied.
Allow students to use their anchor charts as references.
Review (10 minutes):
Recap the key components and uses of each type of graph.
Answer any questions and provide additional clarification as needed.

