Plataforma de Educação Humanizada

Torne-se Membro

Count Skittles and Create a Circle Graph

Disciplina:
Ano escolar: 2nd
Tipo de Recurso:
Tags:

Skittles (or other small, colorful candies)
Circle graph template or large paper to draw a circle graph
Rulers (optional)
Markers or colored pens
Pencils
Scissors (if using paper for the graph)
Introduction (5 minutes):

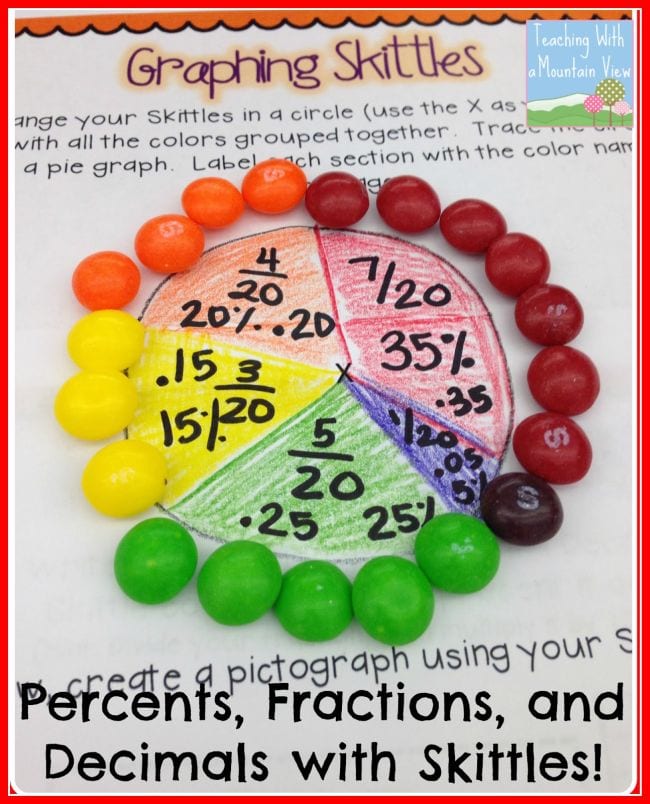
Explain the activity and its objectives. Discuss how students will use Skittles to create a circle (pie) graph and how to calculate fractions and percentages from the data.
Show examples of circle graphs and explain how they represent parts of a whole.
Counting and Sorting Skittles (10 minutes):

Give each student or group of students a set number of Skittles.
Instruct students to sort the Skittles by color and count how many of each color they have.
Creating the Circle Graph (20 minutes):

Provide students with a circle graph template or large paper to draw their own circle graph.
Have students divide the circle into sections based on the number of Skittles of each color. Each section should represent the proportion of each color in relation to the total number of Skittles.
Students will color each section of the circle graph to match the color of the Skittles and label each section with the fraction and percentage of that color.
Calculating Fractions and Percentages (10 minutes):

Guide students in calculating the fraction and percentage of each color. For example, if there are 10 Skittles in total and 3 are red, then the fraction for red is 3/10 and the percentage is 30%.
Have students write these calculations next to the corresponding sections of their circle graph.
Presentation and Discussion (10 minutes):

Allow students to present their circle graphs to the class, explaining the proportions of each color and how they calculated the fractions and percentages.
Discuss any observations and compare different graphs to see how the data varies.
Review and Reflection (5 minutes):

Recap the key components of creating and interpreting circle graphs and how fractions and percentages relate to the graph.
Ask students what they enjoyed about the activity and what they learned from it.