Plataforma de Educação Humanizada

Torne-se Membro

Create Pictographs Using Toys

Disciplina:
Ano escolar: 2nd
Tipo de Recurso:
Tags:

A variety of toys (e.g., toy cars, trains, action figures, blocks)
Large poster paper or chart paper
Markers or colored pens
Rulers (optional)
Introduction (10 minutes):

Explain what a pictograph is and how it uses pictures or symbols to represent data.
Show examples of pictographs and discuss how they can represent different categories.
Choosing Toys and Sorting (10 minutes):

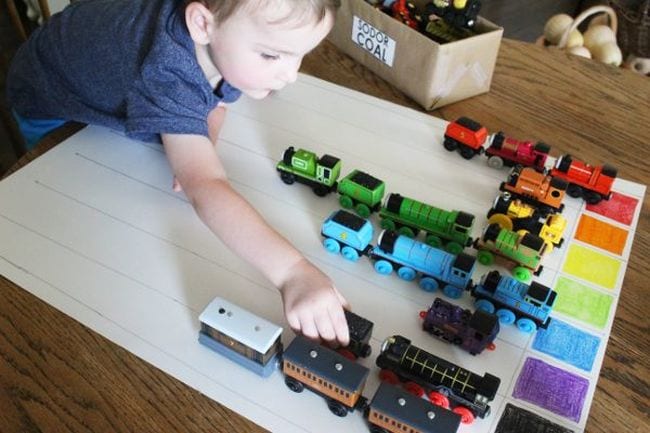
Have students raid the toy box to select a variety of toys.
Decide on the attributes for sorting (e.g., color, type, number of wheels, size).
Guide students in sorting their toys based on the chosen attributes.
Creating the Pictograph (20 minutes):

Provide each student with large poster paper or chart paper.
Show students how to set up their pictograph with categories (e.g., different colors or types of toys) along the x-axis and the number of items on the y-axis.
Instruct students to draw or paste pictures of their toys onto the paper to represent the data for each category.
They can use toy images or draw simple representations of the toys.
Presentation and Discussion (15 minutes):

Allow students to present their pictographs to the class, explaining the categories and the number of toys in each category.
Discuss which category had the most or least items and what can be inferred from the pictograph.
Review and Reflection (5 minutes):

Recap the key concepts of pictographs and their uses.
Ask students what they learned from the activity and how pictographs help in organizing and interpreting data.