Soft board or large poster board
Pictures of zoo animals (printed or cut from magazines)
Small strips of paper for names and cartoon drawings
Glue sticks or tape
Markers or colored pens
Rulers (optional)
Introduction (10 minutes):
Explain the concept of a bar graph and its purpose in representing data.
Show a simple example of a bar graph with labeled axes and bars.
Choosing Zoo Animals (10 minutes):
Discuss various zoo animals with the students and decide on a list of animals to include in the graph.
Print or cut out pictures of the chosen zoo animals for the activity.
Creating the Graph (20 minutes):
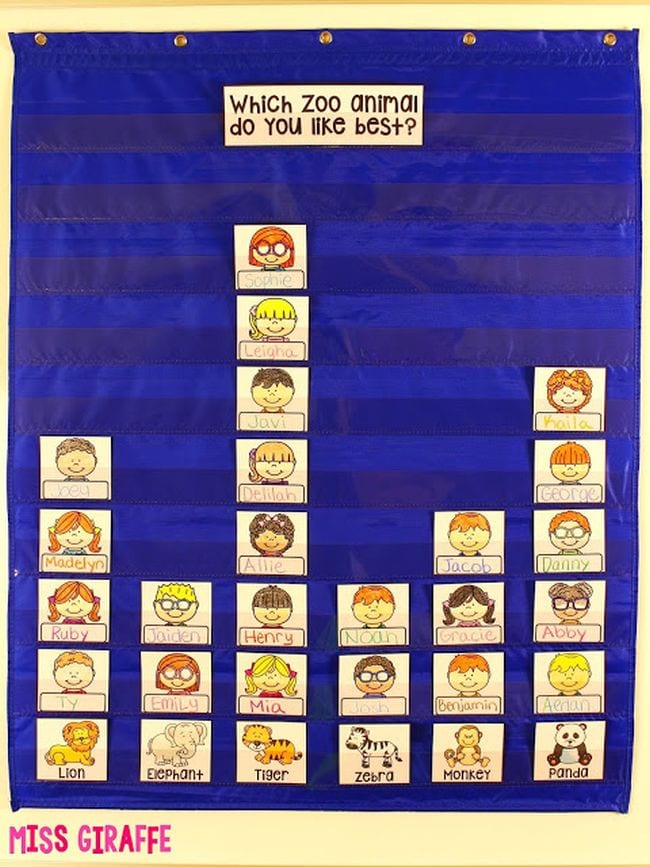
Set up the soft board or poster board with an x-axis and y-axis. Label the x-axis with the names of the zoo animals and leave space on the y-axis for the number of votes.
Have students choose their favorite zoo animal and draw a cartoon representation of themselves on a small strip of paper.
Each student will paste their cartoon drawing and name on the soft board next to the corresponding zoo animal picture on the x-axis, creating a bar graph.
Labeling and Completing the Graph (10 minutes):
Assist students in counting the number of votes for each animal and labeling the bars accordingly on the y-axis.
Ensure all pictures and names are securely pasted and properly aligned to form clear bars.
Presentation and Discussion (10 minutes):
Have students present their graphs to the class, explaining which zoo animal received the most votes and how the graph represents their class’s preferences.
Discuss the results and compare the favorite animals of the class.
Review and Reflection (10 minutes):
Review the key parts of a bar graph and their functions.
Ask students to reflect on what they learned about representing data and how it helps in understanding preferences.

