Platform of Humanized Education

Become Member

Read Books and Make a Tally Chart

Disciplina:
Ano escolar: 2.º ano
Tipo de Recurso:
Tags:

A selection of recently read books or their cover page images
Chart paper or large poster paper
Glue or tape
Markers or colored pens
Rulers (optional)
Pencils
Introduction (5 minutes):

Explain the activity and its objectives. Discuss how students will conduct a survey to find out their classmates’ favorite books and represent the results in a tally chart.
Show examples of tally charts and explain how tally marks are used to count and represent data.
Conducting the Survey (10 minutes):

Have students survey their classmates to determine their favorite book from the selection read recently.
Each student should record their favorite book on a piece of paper.
Counting and Recording Data (10 minutes):

Collect the survey results and tally the number of votes each book received.
Record the tallies on a piece of paper for reference.
Creating the Tally Chart (20 minutes):

Provide students with chart paper or large poster paper.
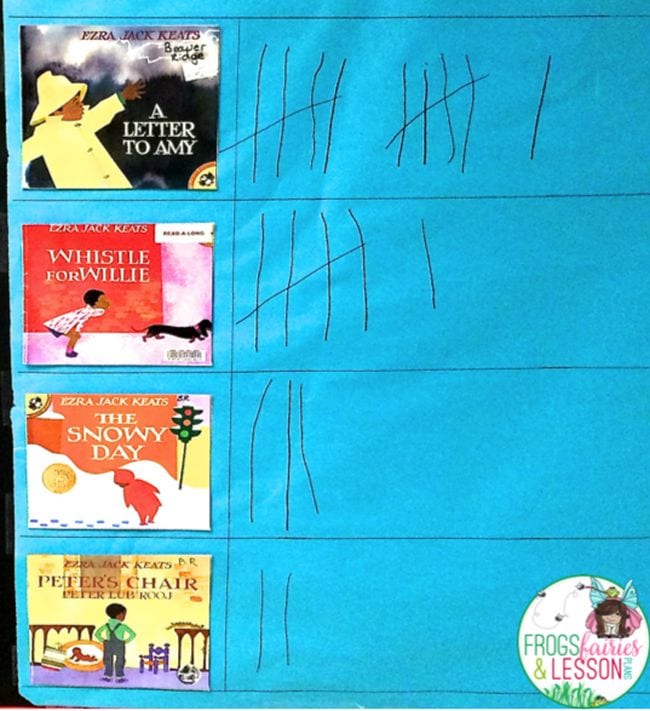
Instruct students to draw columns for each book, using the cover page images of the books or drawing simple representations of the covers.
Have students draw tally marks horizontally in front of each book’s column to represent the number of votes each book received.
Presentation and Discussion (10 minutes):

Allow students to present their tally charts to the class, explaining which book received the most votes and which received the least.
Discuss any patterns or observations, such as the popularity of certain books.
Review and Reflection (5 minutes):

Recap the key components of a tally chart and how it helps in organizing and interpreting data.
Ask students what they learned from the activity and how it helped them understand data representation.

en_GBEnglish